Insights
Original loan-level research on US housing finance, drawing on the full HMDA, GSE, and Ginnie Mae loan-level disclosure record. Each post is data-led, methodology-transparent, and informational only — not investment, lending, or compliance advice.
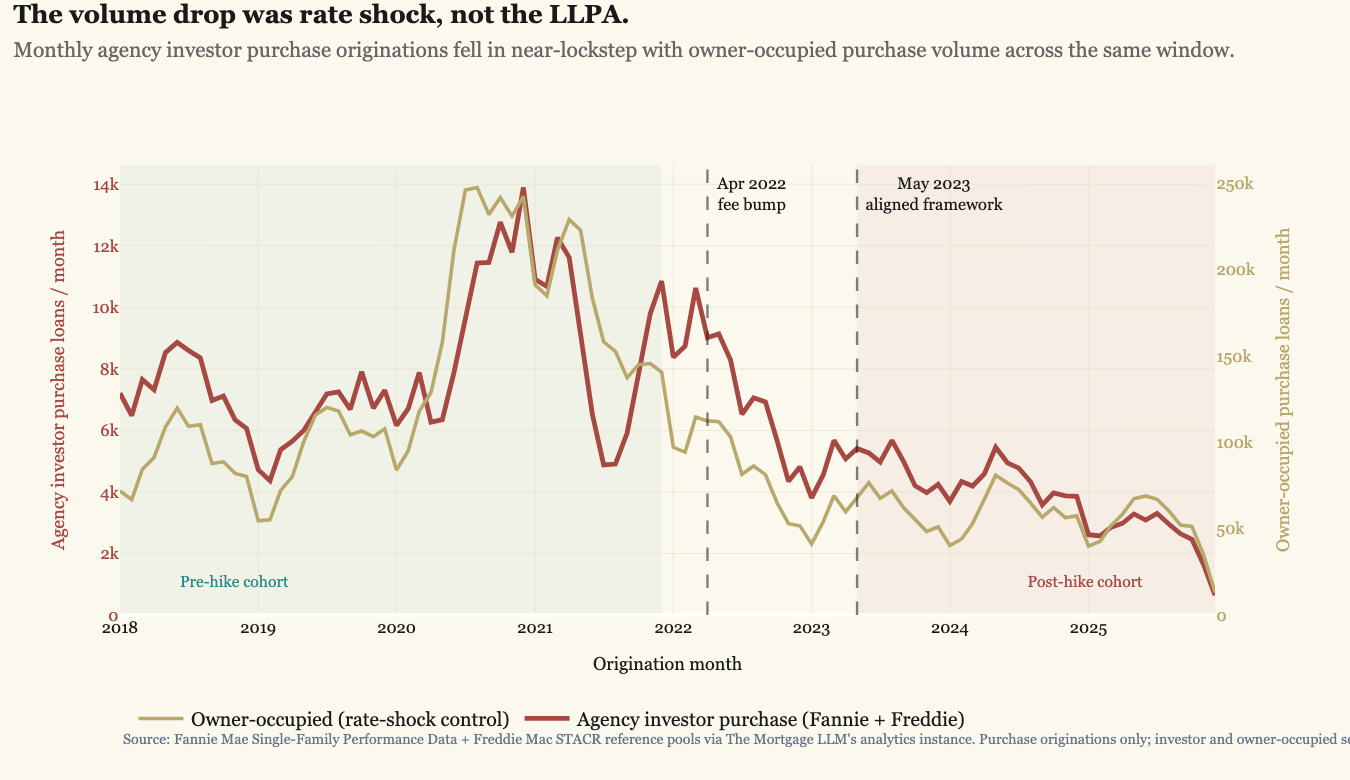
What the investor LLPA hike actually did
The 2022-2023 investor LLPA hike moved top-of-grid pricing from ~175 bps to ~400 bps. Three years of loan-level GSE performance data lets us answer what it actually accomplished. The volume story is rate shock, not the LLPA: agency investor purchase originations fell 59% by count from Q4 2021 to Q4 2024, but owner-occupied purchases fell 59% in the same window. What the fee genuinely did was select. The surviving agency investor book shows p10 FICO up 10 points, mean LTV down 2.7pp, state mix rotated away from CA/AZ/CO/WA toward TX/OH/NC/TN, and in matched FICO/LTV cells the post-hike cohort experiences 22-25% of the pre-hike early-stress rate. About 4pp of the investor purchase market shifted from agency execution to private-label / bank portfolio channels between 2021 and 2024 - real substitution, but a modest one, and disproportionately the marginal risk the LLPA was designed to price out.
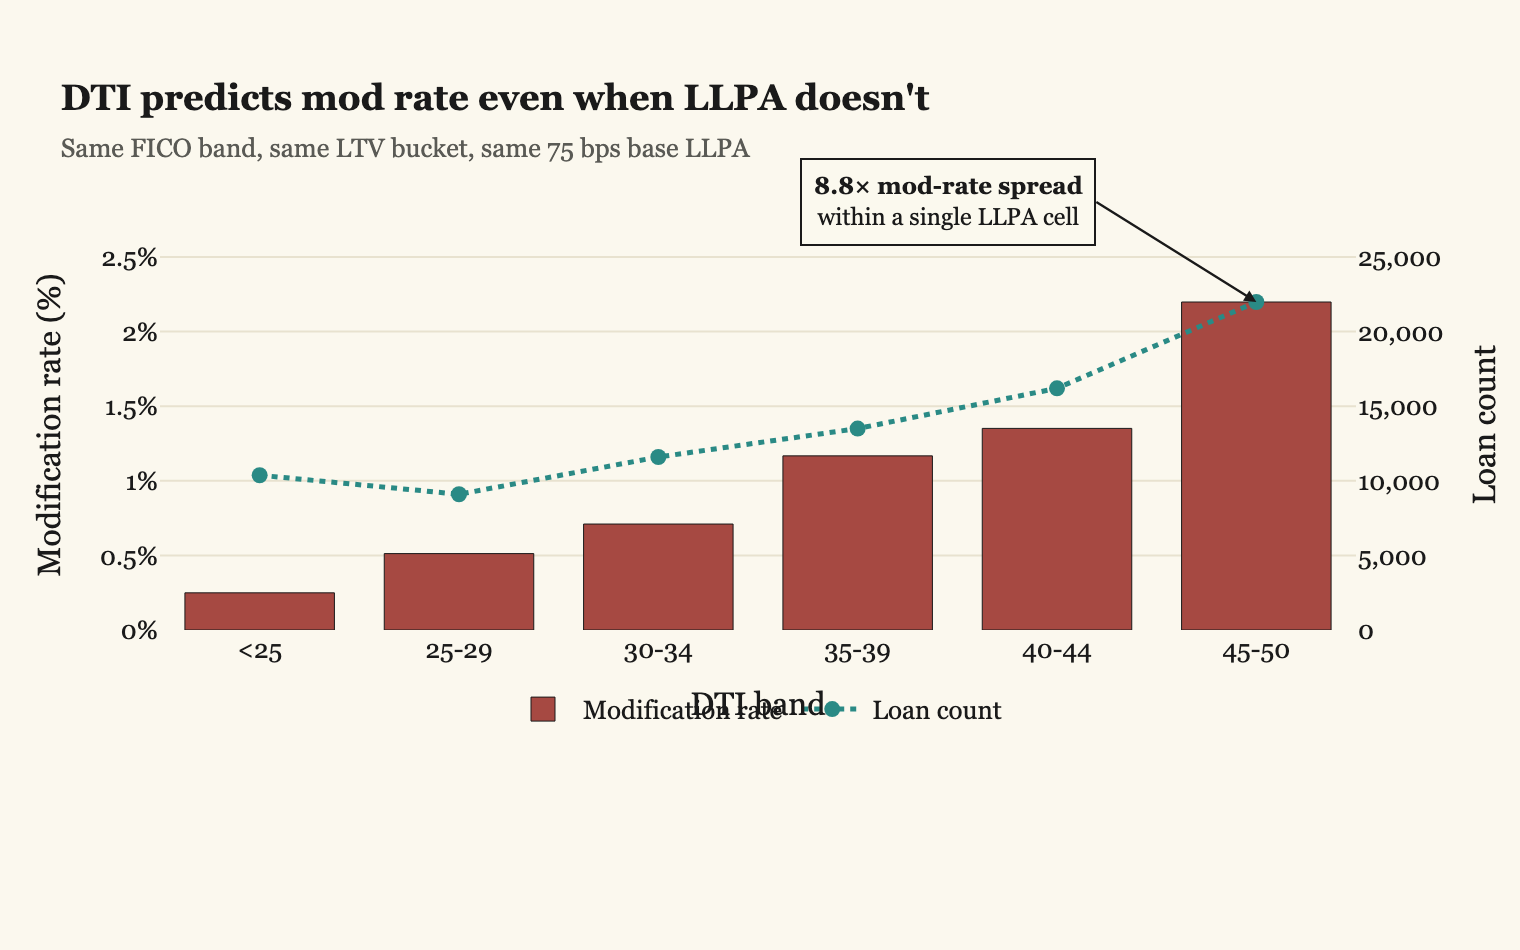
The LLPA grid prices a politically tolerable subset of mortgage risk
The Fannie/Freddie LLPA grid prices what's politically acceptable, not what's actuarially complete. Within a single LLPA cell — same FICO band, same LTV bucket, same 75 bps base fee — modification rate varies 8.8× across DTI sub-bands and 21× across states. The DTI gradient is independent of note-rate-based pricing: it persists 4-7× within every rate band. The unpriced risk doesn't vanish — it migrates to MSR strips, spec pool pay-ups, lender overlays, and ultimately to borrower-facing rate spread. A descriptive map of where the risk function flows, useful for loan officers, capital markets desks, MSR owners, and rate-sheet engineers.
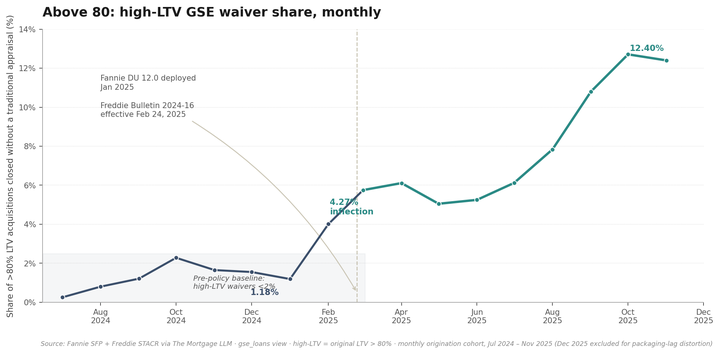
Above 80: the GSE appraisal-waiver ceiling that fell in February 2025
For most of the past decade, conventional conforming appraisal waivers were capped at 80% loan-to-value. That ceiling fell quietly in early 2025 — Fannie's DU 12.0 release in January and Freddie's Bulletin 2024-16 effective February 24 extended pure waivers to 90% LTV and Property Data Collection waivers to 97% LTV. In the loan-level data, Fannie's high-LTV waiver share quadrupled from 1.18% in January to 4.27% in February 2025, then climbed to 12.4% by November. At 95+ LTV the policy fingerprint is exact: every waiver in the sample is a PDC waiver. Fannie and Freddie diverge on the rebuild — Fannie betting on PDC adoption, Freddie betting on pure ACE recovery.
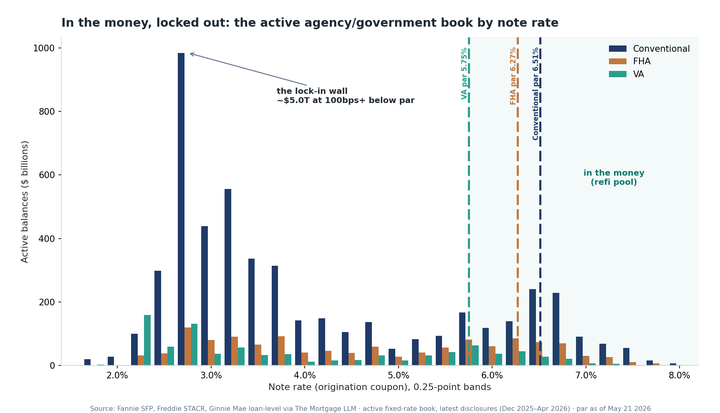
In the money, locked out: where the refinanceable book actually is
About $289 billion across roughly 1.05 million loans in the active agency and government book sits at least 75 bps in the money to refinance today — a real, callable pipeline a loan officer can rank by state, product, and vintage. It is also a sliver: only 4% of a $7.1 trillion book, sitting on top of $5.0 trillion (71% of the book) locked in a full point or more below par. The refi pool is disproportionately a government story (6.0% of FHA, 7.1% of VA vs. 3.0% conventional), heavily concentrated in 2023-2025 vintages (~93% of the pool), and densest in the lower-cost interior (Oklahoma 7.6%, Ohio 6.4%) even though Texas, Florida, and California lead by raw dollars.
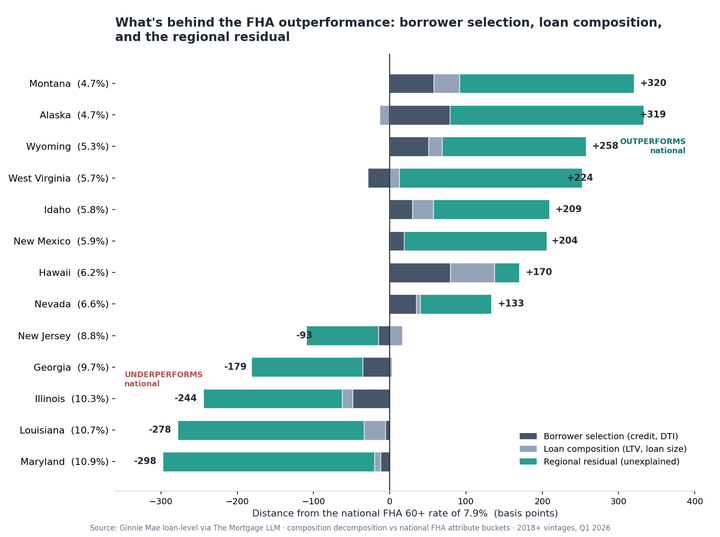
Where, not who: why eight states are beating the FHA credit cycle
Eight states are running 130 to 320 basis points below the national 7.9% FHA 60+ delinquency rate — Alaska, Montana, Wyoming, West Virginia, Idaho, New Mexico, Hawaii, and Nevada. A Shapley decomposition into borrower selection, loan composition, and regional residual finds that only about a quarter of the gap is explained by who these states lend to or what they originate. Three-quarters is geography — the accumulated home equity cushion that doesn't show up in origination-time FICO or LTV but lands squarely in the residual. Hawaii is the lone exception where loan mix does the work; West Virginia outperforms by 224 bps despite a mean FICO 10 points below the national average.
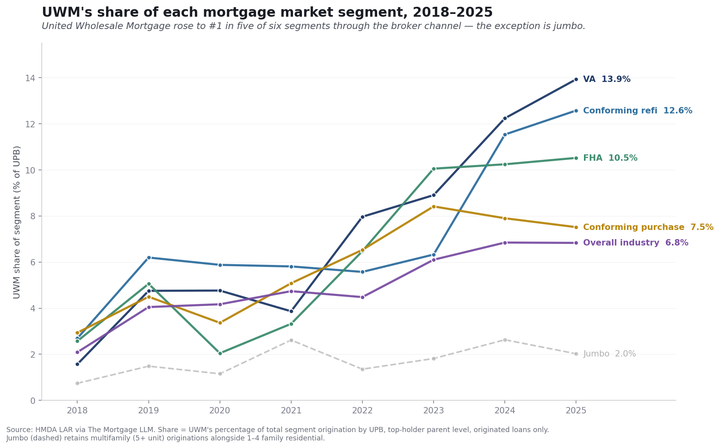
One channel, five segments: how UWM took the top of US mortgage lending
By year-end 2025, United Wholesale Mortgage was the largest originator in five of the six major segments of US mortgage lending — overall, conforming purchase, conforming refinance, FHA, and VA — all through a single distribution channel: independent mortgage brokers. The lone holdout is jumbo. Chronology of a six-year takeover + the structural boundary the wholesale model has yet to cross.
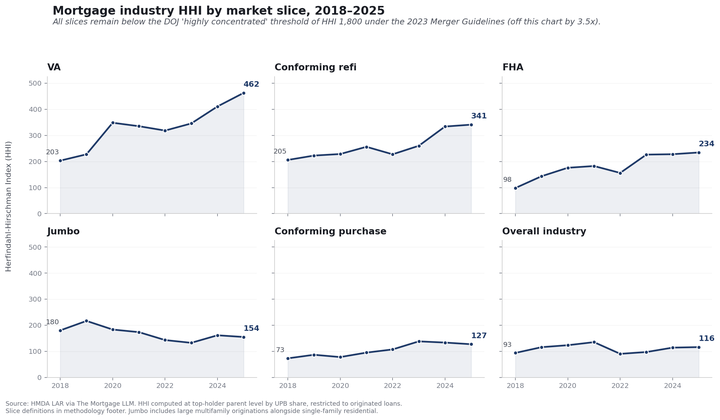
How concentrated is the mortgage industry? An HHI decomposition across market slices, 2018–2025
Across HMDA's full 2018–2025 origination disclosure, every market slice in US mortgage origination sits far below the DOJ 'highly concentrated' HHI threshold of 1,800 under the 2023 Merger Guidelines — the most consolidated slice (VA) is at 463, the least (overall) at 116. The structurally novel pattern is United Wholesale Mortgage's emergence as the top originator across five of six slices post-2020. Six-slice HHI map + slice-by-slice top-5 analysis.
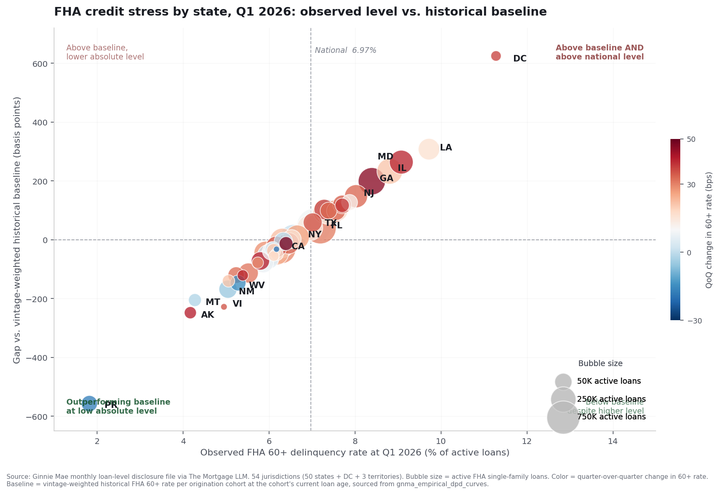
Where the FHA credit stress is concentrating
The national FHA 60+ rate hit 6.97% in March 2026, but the real story is state-level: a 5pp spread between the most- and least-stressed states, with 10 states running more than 100bps above their vintage-weighted historical baseline. State-level decomposition + baseline-gap analysis.